9. Reports
New in version 16.02.
Changed in version 17.02.
9.1. Reporting Overview
Reports
9.2. Tabular Reports
9.2.1. Columns
All data fields available against the report data, i.e. the Assets, Locations or Products are listed under Columns. By default, some Columns will be selected, however the User can show or hide any columns they choose.
Any EAV fields that have been configured within TRACKIT will also be listed and can be included in the report data.
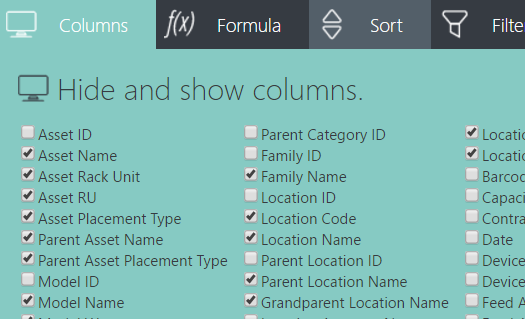
Columns can be selected or unselected.
9.2.2. Formula
Formulas allow the User to create a new field of data in the report based on the data columns available.
It’s possible to determine the Type of Data, i.e. date, number, text etc. and display the values in specific formats, as gauges or colours.
Any additional Formula columns created can be sorted, grouped, filtered etc as with any other fields.
Formulas are expressions made up of columns, constants, functions, and operators.
Columns are values that come from the data. Their names are are enclosed in square brackets, like [ShippedDate]. Depending on their data type, they may be used as text strings, numbers, and date/time values.
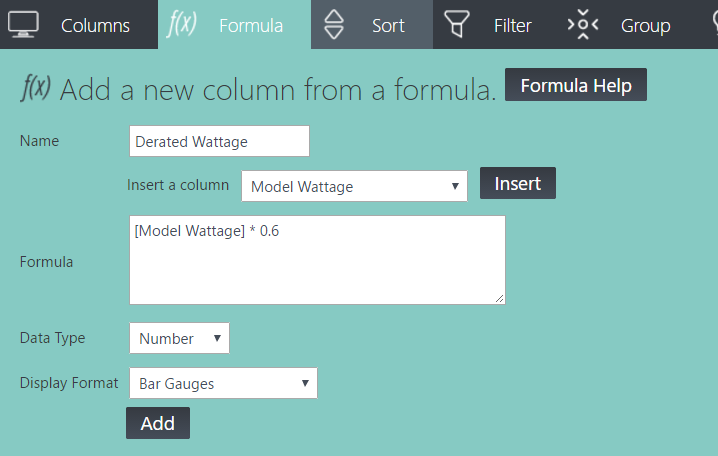
An example of a Formula in the Reporting.
Here are some other examples:
[Price] * [Quantity]
Multiply two data columns, Price and Quantity, to make an ExtendedPrice column:
[Price] * .04
Multiply a data column by an constant value to calculate the tax applied to the price:
DateDiff("d", [OrderDate], [ExpiryDate] )
Get the number of days from the order to the shipment:
DateDiff("w", [ExpiryDate], Now )
Get the number of weekdays since the shipment date:
WeekdayName( Weekday( [ExpiryDate] ) )
Return the name of the day of the week of the shipment date:
[LastName] + ", " + [FirstName]
Concatenate columns and strings together. This might return: Smith, John:
UCase( [LastName] + ", " + [FirstName] )
Convert to upper case. This might return: SMITH, JOHN
9.2.3. Sort
This option provides the functionality to Sort columns depending on the content. It’s possible to sort on multiple columns in a specific order of priority.
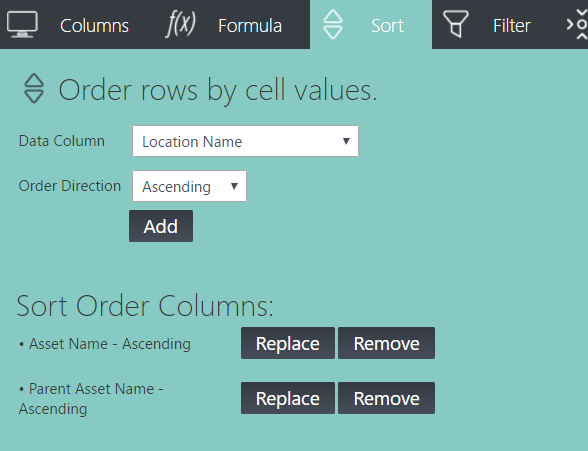
An example of sorting on multiple columns.
9.2.4. Filter
The filter function allows the User to display or hide specific data based on the data itself.
It’s possible to filter on multiple columns and individual columns multiple times.
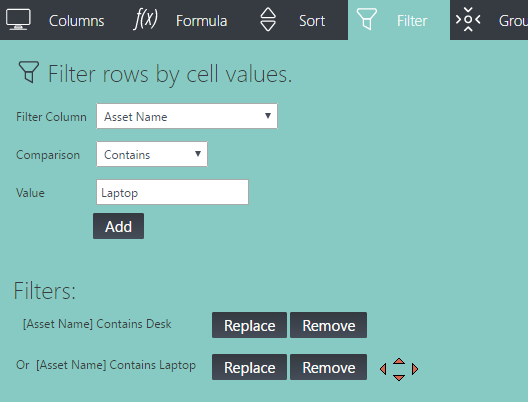
An example of filtering on multiple values.
When filtering multiple times, selecting the And/Or text between the Filter row swaps the Filter rules from And (where the data being filtered must meet both requirements), or Or (where the data being filtered can meet either of the requirements).
The following types of Comparison operators are available:
- =, Equals, the data being filtered must match the given string exactly
- <, Less than, the data being filtered must be less than the given value
- <=, Less than or equal to, the data being filtered must be less than or equal to the given value
- >=, Greater than or equal to, the data being filtered must be greater than or equal to the given value
- > Greater than, the data being filtered must be greater than the given value
- Not =, The data returned will not exactly match the given string or value
- Starts With, The data returned will start with the given string
- Contains, The data returned will contain the given string
- Not Starts With, The data returned will not start with the given string
- Not Contains, The data returned will not contain the given string
9.2.5. Group
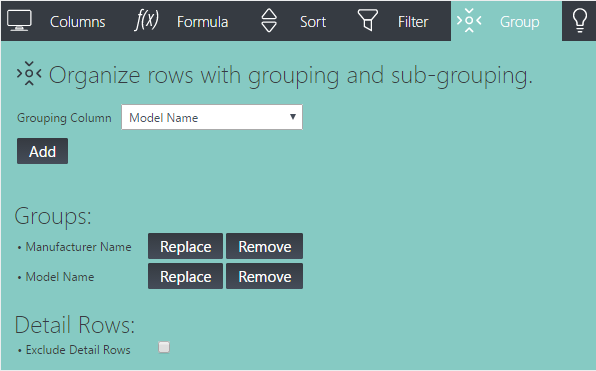
An example of grouping on multiple columns.
9.2.6. Aggregate
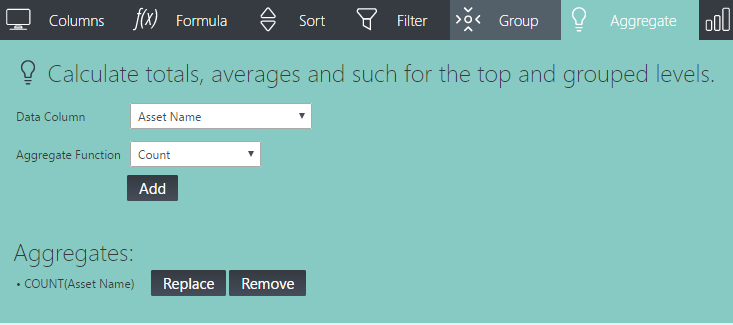
An example of an aggregate value on grouped data.
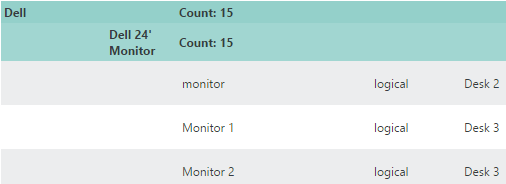
The results of an aggregate value on grouped data.
9.2.7. Chart
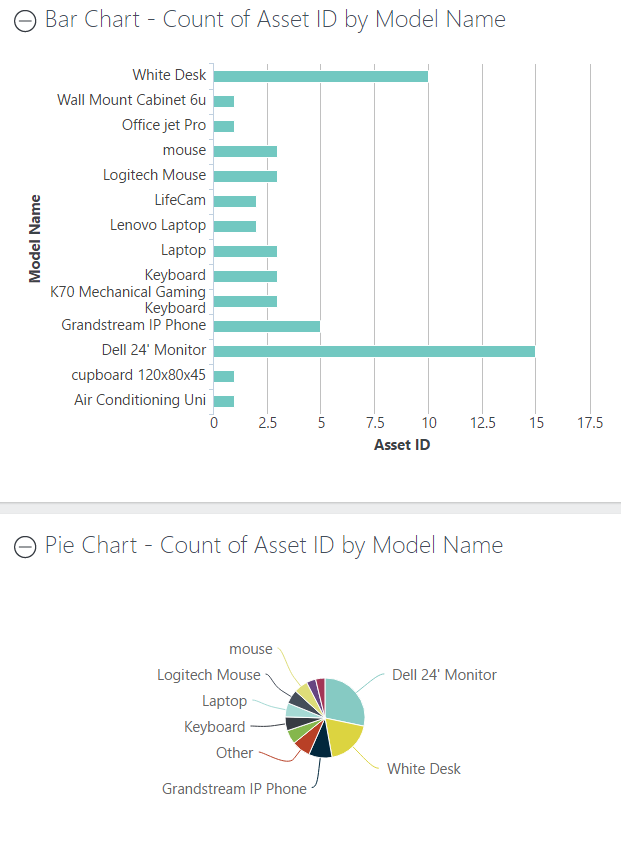
A bar and pie chart, showing the same data, number of Asset per Product Manufacturer.
9.2.8. Crosstab
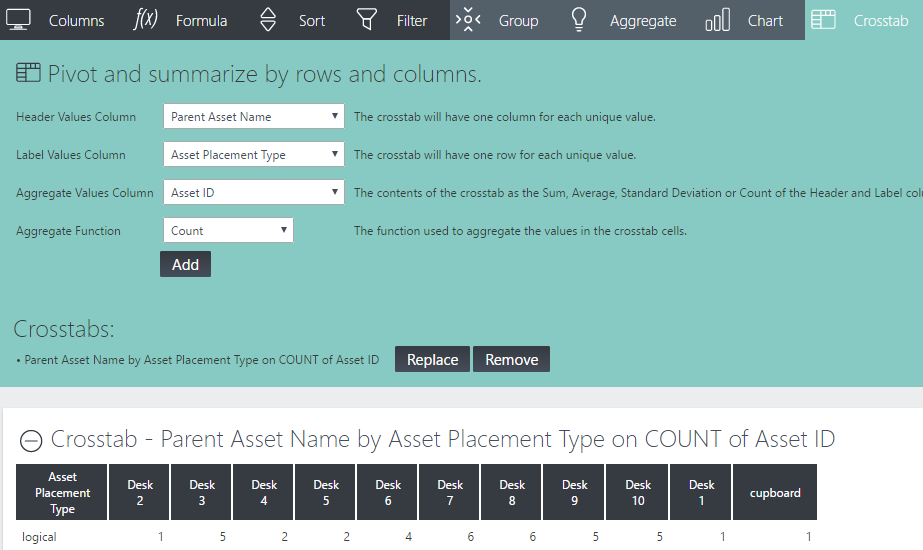
An example of a crosstab showing the number of Assets per Parent Asset in a Location.
9.2.9. Paging
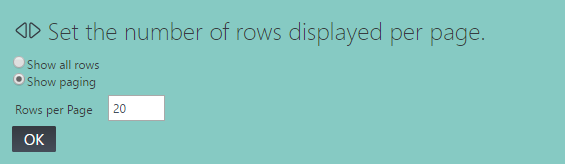
A view of the Paging options.